fbpx

What is RATSI?

Looking for a new way to describe roles and responsibilities (R&R)? It is one of the core benefits of process mapping and the most common approach is often RACI analysis. However at Skore we recommend a clearer approach – RATSI.  We’ll take a look at how RATSI works and why we think it is so much better as an alternative plus you can download our guide to getting started with using RATSI.
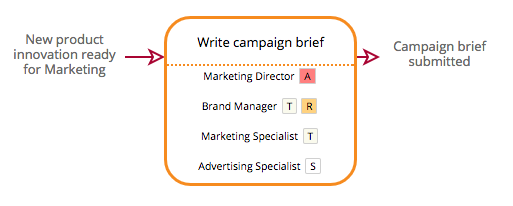
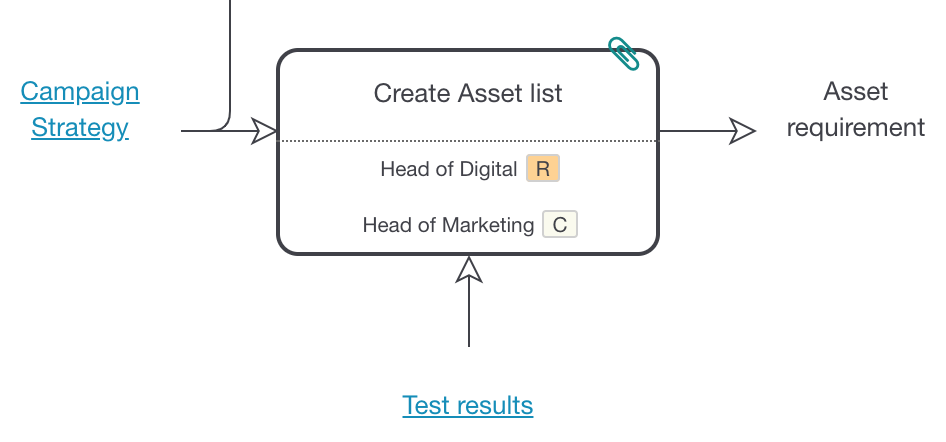
Process step with RATSI displayed
A process activity described in Skore with RATSI applied

Identifying responsibilities – Why is it important.

Firstly let’s look at the reasons why you need to identify responsibilities when looking at Process Improvement. 

You will always need to know who will be involved in a piece of work and what is expected from them. This is about role clarity and setting the right expectations for every member of the team. Capturing roles and responsibilities allows a process to remain high level while still gathering all the elements involved.

    Free Guide to using RATSI in Process Improvement

    The Problem with RACI 

    RACI has been most popular notation for R&R analysis but we find it falls short of being as clear as it should be.

    RACI stands for Responsible, Accountable, Consulted and Informed. The problem is that in reality everyone has their own definition and understanding of what each of these terms means. If you’ve had experience of using RACI – you may have even argued with colleagues over the difference between Responsible and Accountable.

    It is also true that in many languages “Accountability” translates literally to “Responsibility”. In the world of global business this lack of clarity can lead to a lot of mistakes or confusion. In comparison RATSI does not use this concept of “Accountability” at all.

    Instead it uses :

    • Authority over the work (but is not involved) and decision maker
    • Responsibility for ensuring that the work is done.

    What is RATSI?

    RATSI stands for:

    • Authority – “owns” the activity or the decision to be made. Clearly not involved in the day to day work.
    • Responsible – for ensuring the activity is done (not necessarily doing the work but ensuring it is completed to an agreed standard).
    • Task – actually does the work as described.
    • Support – provides inputs in exceptional situations / edge cases (otherwise it would be Task).
    • Informed – is informed the activity will happen / has been done (successfully or not!).

    It is important to recognise that you can have more than one term assigned to you. In fact: someone could have Authority, Responsibility AND Task on a given activity!

      Free Guide to using RATSI in Process Improvement

      RATSI – Understanding how to use the matrix.

      Often people have questions over how to apply RATSI to their processes. Here are the answers to some of the common questions we see.

      Can I have multiple Authorities or Responsibles for a given task?

      You should aim for one unique Authority / Responsible per task. However if they don’t contradict each other you may have several on one activity. See this example:

      In this example ‘Personal Care’ and ‘Home Care’ are 2 different business units that don’t approve the same campaign briefs. Therefore there is no conflict in the roles & responsibility.

      When do I use Support vs. Task?

      Try to consider if the person is involved in every occurrence of the process. If so then it should be Task. If you have any doubts then this is itself is often a good enough reason to “upgrade” it to a Task – remember you can always change it later. 

      How many roles in total?

      Finding the balance between a comprehensive list of roles and a process that is easy to read is challenging. It comes down to your personal preference. Take a look below:

      Often when you see a long list of roles, actually its just variations of a given role. Keep your list of roles short by:

      • Focusing on describing the process clearly
      • Prioritising the Responsible.
      • Writing a “generic” role for the Task

      In the Skore platform, you could write the complete list in a ‘Sticky Note’, or an attachment, if you want to capture it separately from the activity thus keeping your process map clean and clear. 

      3 things to remember with RATSI

      • Role clarity is at the core of your process mapping exercise, whether it’s RATSI, RACI or your own variation, it’s important to understand who does what
      • Limit the number of roles against an activity to keep the process readable
      • Limit the number of Authority and Responsible to one where possible

      Sound interesting? Get in touch to find out more about how to improve Roles and Responsibilities in your organisation. Skore is the cloud-based Process Improvement Software Platform designed to be used and understood by everyone in your organisation. You can use Skore with any R&R matrix you choose when capturing your processes.

        Free Guide to using RATSI in Process Improvement

        Looking for a RACI Alternative?

        There are RACI alternatives out there that can help you. In this blog we’ll explore your options plus you can get access to our simple guide on how to apply these different methods to your Process Improvement Initiatives.

        Do you need a clearer way to analyse roles and responsibilities in your organisation?

        Struggling to find an effective method that gives you the data you need from the information you put in?

          Free Guide to How to Use RATSI in Process Improvement

          We’ll examine how to tackle the vagueness of RACI that so many of us find so confusing and demonstrate easy ways of digesting the information, especially in large and complex documents. If you need a RACI alternative then read on to discover more.

          Fixing the RACI terminology confusion

          Let’s start by tackling the terminology… As a reminder RACI stands for 

          • Responsible
          • Accountable
          • Consult 
          • Inform

          We use RACI to give everyone a level of responsibility in each activity. The point is that it should then be clear what is expected of everyone working on that activity. However, the truth is that often we have different views on the meanings. Especially the difference between Responsible and Accountable. 

          In this RACI blog we explain why we think Responsible is the person who does the majority of the work and Accountable is the person who owns the output of the work – like the director or process owner for example. 

          However lots of people might disagree with this. In addition, for international companies, there is the added challenge of being lost in translation. Responsible and Accountable can mean the same thing in other languages. Which can lead to much confusion!

          There are a number of RACI alternatives that correct this issue and our favourite is RATSI. 

          RATSI as a RACI Alternative

          RATSI stands for: 

          • Authority – “owns” the activity or the decision to be made. Clearly not involved in the day to day work.
          • Responsible – for ensuring the activity is done (not necessarily doing the work but ensuring it is completed to an agreed standard).
          • Task – actually does the work as described.
          • Support – provides inputs in exceptional situations / edge cases (otherwise it would be Task).
          • Informed – is informed the activity will happen / has been done (successfully or not!).

            Free Guide to How to Use RATSI in Process Improvement

            RATSI is our favourite because it stops the vagueness and confusion. In RATSI, R is still Responsible but it means the owner not the doer. The doer is T (Task) and A (Authority) is for the person who takes go/no go decision

            Tools for applying RACI or RACI Alternatives

            Common Tools for RACI

            Like any tool, software for capturing, analysing and sharing RACI information should make our lives easier. Of course the purpose of RACI is to actually clarify roles and responsibilities for everyone. The truth is that often the activity makes things even more confusing and leads to frustration. 

            Often we see that RACI charts are represented as a Matrix. Roles are listed along the X or Y axis and key activities along the other. Where the two intersect is where you record the responsibility level – R,A,C or I. 

            The idea is that for any given role you simply follow the row (or column!) for that role and it shows the varying levels of responsibility for each activity. Or you can select an activity and look at the matrix to see who is involved. Spreadsheets can be used for this type of grid and therefore RACI matrices are often produced in Excel or Google Sheets. Some project management software products also have a RACI matrix capability as well. Drawing softwares such as MS Visio can also include templates for making a matrix although they can be harder to manage and update when things inevitably change. 

            Skore, the Process Improvement platform was designed to handle RACI matrices and below we’ll explain in more detail how it can help you solve your RACI/RATSI queries. 

            The main problems with common RACI tools

            While creating a RACI matrix in something like Excel seems straightforward, actually it has a number of problems which means people search for a RACI alternative. How often have you spent days creating a matrix to find that no one ever looks at it again? Or worked hard to craft a detailed spreadsheet only to be told that it’s still too confusing to understand everyone’s roles and responsibilities? 

            If this is you, have you considered that a matrix rarely exists without a process diagram alongside it? And that the activities represented in the matrix are generally part of a wider process. So it makes sense that the team really needs to understand the process in the first place. 

            However often we create the process as a separate document and it’s referenced separately. Or the team hasn’t understood the process. It makes sense that activities in the matrix are going to be pretty unclear in that case. Even worse if there are lots of detailed activities it will lead to an enormous matrix which is impossible to read. 

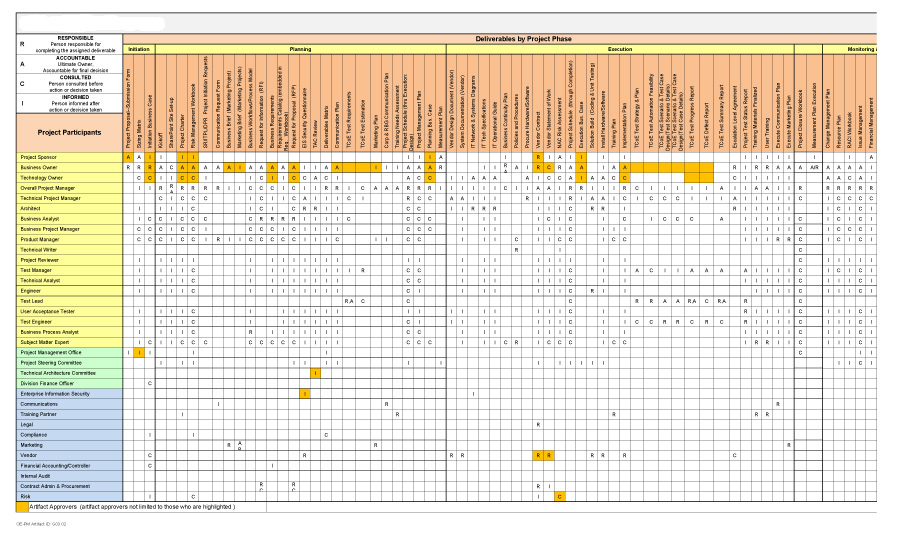
            A large and complex RACI Matrix in Excel

            SKORE – an easy, simple way to capture and understand RACI or any responsibility matrix.

            Skore was designed to incorporate simplicity at every level. The process improvement platform uses UPN – the easy process mapping language designed to be understood by anyone in your team. In Skore every time a user assigns a role to an activity they assign a responsibility. This means that the team can focus on one activity at a time and agree on the responsibility level together.

            RACI Alternative - RACI tags on a process
            Roles are tagged with RACI when added to an activity

            So while you map a process in a workshop, Skore automatically creates role descriptions. These show the activities of each role as well as the responsibility level. If you’re using a RACI alternative, Skore supports models such as RATSI and RAPID or allows you to create your own custom model.

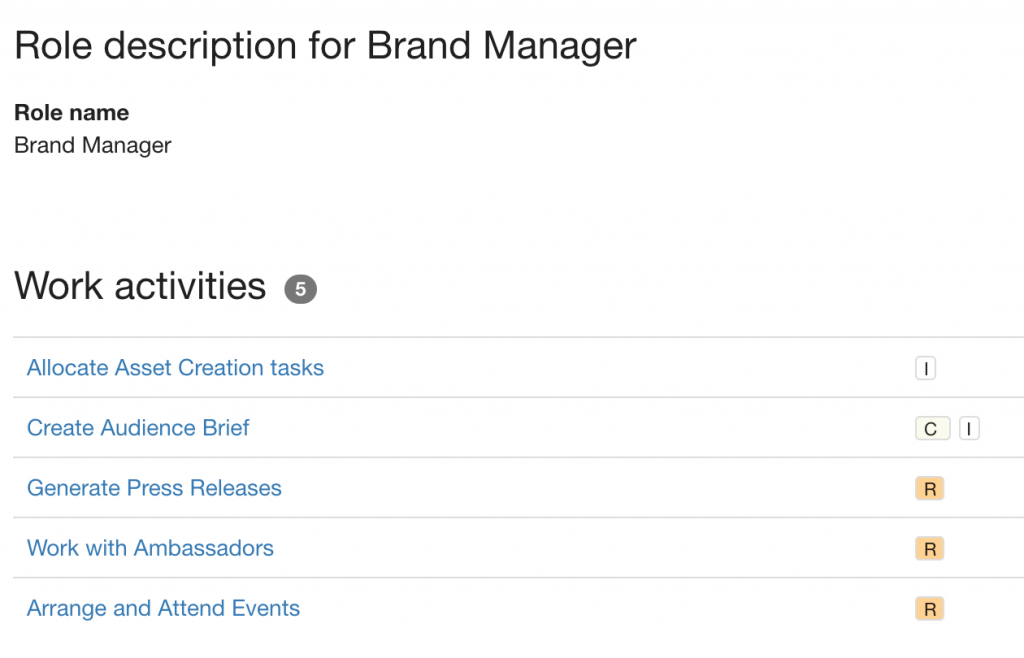
            RACI Alternative - Role Descriptions
            A simple role description showing RACI tags

            Easy to Read Matrix

            Even better, Skore effortlessly creates a simple RACI matrix using the Reports tab. Plus, if you prefer, it can be exported to a spreadsheet when needed.

            This means one of the main benefits is that you store a visualisation of the process alongside the RACI information, rather than having two separate documents. Plus, Skore links the information so updating the process means you are also updating the RACI information and vice versa.

            Many companies also use tools such as RACI for organisation design. Either if they are are designing completely new processes, or transforming existing processes. In this case RACI helps to design new roles in the organisation. The Skore platform’s powerful analytics help you determine whether you have the right balance of responsibilities across the team.

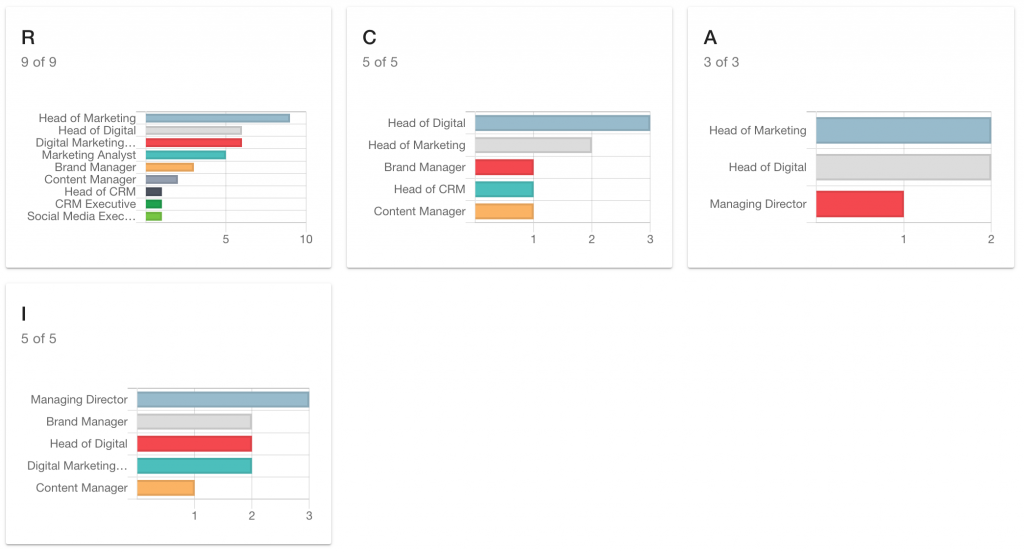
            RACI alternative - visualisations
            One of various visualisations that help with role design

            It can even help you model scenarios to understand how many people you need to run the process, based on their responsibilities.#

              Free Guide to How to Use RATSI in Process Improvement

              Conclusion

              RACI is a powerful tool for helping teams to clarify roles and responsibilities but it comes with a number of challenges. This results in people looking for a RACI alternative. To find the right solution first evaluate the specific challenges you face and try to identify what the true issue is. For example, if it’s because you are suffering confusion and vagueness around the RACI acronym then look to use an alternative such as RATSI.

              If you are struggling with an overly complex matrix or a lack of understanding from yourself or your organisation, then re-evaluate the tools you are using in the first place. It could be that Skore is the solution given that it combines the power of simple process mapping with RACI and analytics. If you’d like to find out more about how we can help you then get in touch with the team below. 

              Digital Transformation in Construction – Keep it Simple

              Digital Transformation

              Digital transformation is on the mind of every leadership team across all industries, not just construction. But what is digital transformation? A search online will return mountains of articles, research, opinion pieces and many more all describing wildly different descriptions.

              You’ll hear about the customer journey, digital first interactions, reducing friction etc. A lot of what you read about will be from the retail industry or finance, disruptive business models and so on.

              From a construction perspective how do you make sense of this all?

              Digital transformation in construction

              Today digital transformation is relative and depend on your industry as a whole and where it sits in relation to digital. It is about where you are today, your starting point, where you are trying to get to and how you can use digital technology to get there. In essence it’s about improving productivity, profitability, experience, automation and, perhaps most importantly, innovation.

              In that sense it’s no different from any sort of industrial improvement technique that has come before. Except now the pace of change in digital technologies is so high that you need a new capability in your business that can keep on top of it and continuously implement the latest innovations.

              Back to basics

              For construction it will come as little surprise to most in the industry that things still tend to happen largely on spreadsheets. Even basic task automation found in other industries will be completed on spreadsheets and shared via email in construction. Files are still stored on shared drives and approvals are made with wet signatures.

              Given this starting point I’d urge anyone considering digital transformation in the construction industry to not get carried away and take advantage of the enormous opportunities for improvement right in front of them.

              Tools for creating simple workflows, with approvals, controlled document storage and mobile friendly are readily available and easy to use. More traditional Enterprise Resource Planning (ERP) tools are easier to use and easier to configure than ever before. Most tools nowadays include some sort of Application Programming Interface (API) that allows it to connect to a variety of other tools so you can reduce data entry and emails.

              However, given how easy to use and accessible these tools are it’s very easy to implement the wrong thing in the wrong way. And that’s where this new capability comes in.
              Digital Discovery for digital transformation

              Creating, or configuring, automated workflows may seem easy, but to do so in a scalable and future proof way requires a bit more skill. It’s important to consider the wider business to understand how this new workflow fits in. What are the inputs required, what outputs are expected, who will do it, what is the escalation path when something goes wrong, what is the data model required, who else needs to know?

              Using a digital discovery tool such as Skore will make this much easier. It will allow you to rapidly build a model that describes how your business works, where the gaps are and answer the questions above. You can use this model to build and test your new automated workflows before you roll them out to your team.

              Infact digital discovery is best started before you’ve even selected a technology for your transformation. The model produced will form the requirements for that system and can be used in the vendor selection process. Simply take the model to the different vendors and ask them to show you how they would deliver it.

              Successful digital transformation

              In construction, successful digital transformation is all about being aware of your starting point. Don’t try to over think things, or build something that no one would recognise. Keep it simple, identify the things that can be easily automated today that will have the largest impact on the business.

              There is a lot you can do right now to reduce risk and increase productivity, simply by getting rid of those spreadsheets.

              If you would like to learn more about how we can help you on your digital transformation journey please get in touch.

              Asking WHY can save your business a fortune!

              As a consultant, one of the most powerful questions in my ‘toolbox’ is “why”?

              Why do you do that? What’s the value?

              It forces you to think beyond the superficial and dig into the real meaning of a piece of work. To understand what it ultimately adds to your business or customer.

              It’s easy for me, to turn up at a new client’s premises and ask those questions. But why don’t businesses ask it enough of themselves?

              What do you do to ensure you constantly challenge yourself and every person in your organisation, to consider the value in all that they do?

              Asking ‘WHY’ is a great example of how the Skore approach consistently helps businesses using it, stay at the top of their game. It challenges team members at all levels within a business, to think about what they do and why. To always challenge the status quo and ask;

              • What value is this process adding to the customer?
              • How does each step contribute to that value?

              When I am training clients teams on using the Skore approach, I often find the following anecdote highlights the importance of asking WHY.

              Several years ago, I was working with a large construction and services company helping them define a standard process for a back-office function. A mundane but necessary step in their wider improvement programme.

              In one session we started by capturing all the key steps in the process. These were displayed, in the order that they happened, on the screen for everyone to see. The room was full of heads nodding in agreement. A great start!

              I then started to walk the team through each step, asking “why does this step happen?” or “what value does this step bring?”. As we moved through the steps it generated some great discussion and opened up a whole bunch of improvement ideas for the future. Ideas I duly captured and shared with the client team later.

              Eventually we arrived at this innocuous step “produce weekly reports”. Again, I asked the question, “why do we do this?”. The team turned to look at the person who had described the step. “So that the weekly reports are produced?” was the response.

              Hearing the past tense used to describe why something is done often rings alarm bells to me as it usually suggests that there’s little, or worse, no value in the activity. It’s hard to articulate, and isn’t always the case, but is a pretty good indicator that we need to try a little harder to uncover the value. I tried again, this time “OK, what do you do with the report once you’ve produced it?”

              “Print it out and file it in the cabinet at the end of the office” came the reply. At this point the colleagues all looked at each other. My next question, “does anyone use that report?” was met with a sea of blank faces.

              After investigation it transpired that this person was spending three hours every week producing these reports. The reports were filed away and never looked at. What’s more, we found no compliance reason for them to exist.

              It turns out that when the colleague had joined the organisation 18 months before, their predecessor had included this activity as part of their job handover.

              In that time over 210 hours had been wasted and if we hadn’t caught it, many more would have followed!

              Through the application of the Skore approach, the identification of these types, and levels, of waste are commonplace.

              Traditional methods of process improvement require a high level of discipline to apply it correctly, or alternatively, for a consultant to come in and do it. The more commonly used approaches to capturing and visualising ways of working don’t generally ask “why” at each step and therefore improvement opportunities, such as those described above, are easily missed.

              It is for this reason that we built the “why” questions directly into the Skore platform.

              When Skore is used to define and describe work processes it routinely asks;

              • What happens?
              • Who does it? and
              • Why?

              If the questions are not answered, they remain visible until the are completed, acting as a reminder to investigate and understand them fully at some later point during the process.

              Want to learn more about Skore? Request a Demo today!

              Don’t let hidden costs damage your profits

              When a business is embarking on a project, that will fundamentally change the way the organisation works, there are a number of steps to go through in order to properly identify the business aspirations and to understand exactly how change will impact the business. But these projects don’t tend to focus on finding hidden costs.

              Typically, when the Skore team are called in to support this type of transformation project, our client will already have a specific goal, such as implementing a new Enterprise Resource Planning (ERP) system or Customer Relationship Management (CRM) application.

              As a client you will have acknowledged that you have recurring problems, often including; the duplication of effort, repeatedly making the same mistakes, or simply not being able to keep on top of things with your existing working practices. But what other hidden costs might be lurking in the business?

              Perhaps the system being implemented promises a new feature that will allow you to exploit a new process – for example, a client recently benefited from the introduction of an online chat widget, meaning that customers were able to interact directly with the support staff through the website.

              In 2017, we published this article How we saved 80 days of waste during a system implementation. This project saw our client, a tier 1 engineering company, implementing a training administration system to manage the multitude of internal and external training courses they offer.

              With well defined goals for the system implementation, Skore was selected for gathering the requirements. During the early project stages of the initial requirements workshops, we quickly identified the aforementioned extra 80 days of hidden cost!

              Using that article as the catalyst, we decided to review other projects we’ve been involved in and see what additional benefits we helped our clients achieve.

              Another client engaged Skore to support the definition of business processes in preparation for the implementation of a new order processing system. During the definition phase, we once again identified a number of improvement opportunities outside the scope of the core project, including time savings in the processes for ordering, stock management and returns.

              The Skore approach also helped the team identify areas where data duplication was taking place. By addressing these instances, further time efficiencies were achieved through the reduction of duplicated effort and rework.

              In our third example, the project looked at the clients’ product development process. A key factor in using the Skore approach is the detailed understanding of the interactions between all interfacing processes, people and technology. It was within these interfaces our client identified additional pain points that were adversely impacting their customer experience. The additional value added by Skore was being able to assist with resolving these problems outside of the core project.

              This is just a small sample of our projects. However, our ongoing review process found one common theme – that additional benefits are consistently being identified outside of the defined scope of our projects.

              What is most surprising, is that in virtually all cases, these unexpected benefits represent a significant cost saving to the client despite never having previously been identified. In fact, the teams were often not even aware they had a problem until the Skore approach was applied.

              This is why the use of Skore tends to grow within organisations. After its initial introduction as a tool to support the delivery of a specific project, its value in identifying additional, or unexpected, benefits soon becomes clear. Skore can easily be applied to other parts of the business in order to optimise working practices, reduce costs, identify new opportunities and, in turn, increase profits.

              To find out more about how Skore is helping organisations transform their performance and customer satisfaction, take a look at our case studies.

              Or, to discuss how Skore could be applied to your own business, leave your details for one of our transformation specialists to arrange a call.

              10 Steps to the Perfect Process Map

              This blog article was updated on 7th August 2019

              Skore’s success as a software platform undoubtedly demonstrates it’s importance as part of the process capture solution. However our own experiences within the Skore team have also enabled us to master the ability to map out and analyse processes effectively.  We’d like to share with you our steps to creating a process map that will engage and inform your organisation. 

              A simple structure and approach is the most effective. It will get you started, guide you, enable you to learn and build experience. That’s why Skore is based on a simple, yet powerfully flexible, framework for describing and aligning processes, people, systems and data.

              Indeed Skore has the framework built in to it and it makes it quick and easy to apply. However underneath there is still a basic approach that underpins the application of the framework. After the numerous training and discovery sessions Skore have been involved in we’ve put together the following 10 simple steps to creating the perfect process map.

              Need to learn more about Process Mapping? Try our guide here

              So if you want to create good quality and insightful process maps for your organisation in 10 simple steps read our recommendations:.

              10 STEPS TO THE PERFECT PROCESS MAP

              1. SCOPE

              Ask yourself – what is the scope for this process? Make sure you capture the title, initial input and final output

              2. ACTIVITIES

              What is the work to be done? You only need to record the verb and noun for each activities, don’t worry about sequence at this stage or trying to write full sentences. Just get them all down.

              3. OUTPUTS

              For each activity, add the output – our tip is to try to avoid just putting the past tense of the activity, think about the now. 

              4. FLOW

              Only once all the activities have an output should you hook them up. What does this output trigger next? This checks you’ve got the right activities at the right stage of the process. You may be surprised at this stage how many people may disagree with you.

              5. WHO

              A process is never complete until the ‘Who does it?’ is filled in for EVERY activity. For higher levels, who is responsible? For lower levels, who does it? Again this is a very enlightening exercise for the whole team. 

              6. ENRICH

              Add in things like systems, data, document links, requirements, etc… depending on the reason you’re process mapping. Make sure these are captured in the software to show reach and priorities.

              7. TIDY

              Remember this process is for all and you want it to be visually pleasing. Align the tops, space apart… a neat process is a happy process, and it’s pretty satisfying too. 

              8. SHARE

              Don’t keep the process to yourself, make sure the access rights are set up correctly and share the link to a wider audience. Switch on Comments if you want feedback directly. Allow your process map to become a community builder within your organisation. 

              9. REFINE

              Take the feedback and improve the process, update it. Look at the insights generated and use that information to clarify and hone your map. 

              10. PUBLISH

              Decide who should approve the process (usually the Process Owner!) and Publish. Remember, this is just a line in the sand, it will change and need to be re-published. You can always roll back to an earlier version if needs be so don’t be reluctant. A process map is only a useful tool if seen and shared by those who need to. 

              The Skore Digital Discovery Platform is a process mapping, improvement and insights platform. Live workshop functionality, instant updating and shareable, it enables you to align your people, processes and tools. Find out more here

              The Magic of Hierarchy

              The importance of hierarchy

              Probably my favourite tool in the arsenal of analyst techniques has to be decomposition. Whether it’s functional or process decomposition there is nothing like it for arranging problems into the big picture. Then breaking that picture down into its component parts so that you can start to make sense of it.

              And yet hierarchy, in recent years, has got a pretty bad reputation. As Stanford professor Bob Sutton wrote this weekend in this LinkedIn article. He was brought up to believe that hierarchy was bad and led to inefficiency, yet research for his new book showed that hierarchy is unavoidable.

              Hierarchy is nature’s gift to us in helping us understand the World around us. Citing research by his colleagues Deb Gruenfeld and Lara Tiedens he describes how hierarchy is found in every single group of animals found in nature. To quote Gruenfeld and Tiedens directly:

              “When scholars attempt to find an organization that is not characterized by hierarchy, they cannot.”

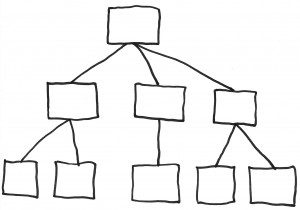
              Hierarchy structures the relationships between people and things into parent, child and peer relationships. This makes it easier for us to remember those relationships, it provides an organising principle that is standardised across everything. We simply have to know how hierarchy works in order to understand something that is new to us.

              This is what makes decomposition so powerful. It comes naturally to us human beings so is not really something that needs much in the way of education. When we apply it, it’s often to an area that seems chaotic and complex. By decomposing we overlay a hierarchy that allows us to understand what was previously incomprehensible. It allows us to break problems down into component parts in order to tackle them effectively and even start to predict what will happen when we make changes.

              It doesn’t just aid understanding, it also helps us to remember. Instead of having to remember every single discreet component of an organisation you simply need to remember a small subset. You can then use this along with the hierarchical organising principle and you will be able to fairly accurately calculate the missing pieces.

              Skore and decomposition

              This is what makes decomposition one of the first things I do when introduced to a new problem and this is why we made decomposition one of the central parts of Skore. It surprises me how few products there are out there that help you do this easily, one of our favourites is Workflowy.

              Right from the beginning we wanted to give people the ability to decompose as thought it was second nature. With Skore you simply capture a few high level actions that describe the ‘big picture’ then use the details button on each What Box to decompose to the next level creating a hierarchy as you go. This means it is really important that you complete the Why Box for each step. The Why Box is used to determine the outcome of each step, what’s expected once the action is complete. By doing this consistently you are setting your scope for the next level of detail and making it easier to focus on that detail.

              Detail button on a What Box in Skore

              When looking at any new problem Skore is one of the first tools I reach for, sketch out the big picture and then explore the details of any relevant parts.

              3 things to remember

              Hierarchy is all around us – it is an organising principle built into nature and helps us understand otherwise complex situations.

              Use decomposition to organise and understand problems – start at the ‘big picture’ and break it down into component parts in order to understand what it is and what to do next.

              Use the Details button in Skore to decompose a step – each What Box has a details button, clicking this will give you a clean canvas with the context of the parent step including the descriptions of the What and Why boxes. You can break individual steps into detail views as often as you need until you reach the right level of detail.

              This is an extended version of an article from Human Automation.

              Learn more about hierarchical process mapping in our Process Mapping Guide.

              Whiteboard versus software

              This is a question that comes up from time to time when introducing Skore to new teams, “is it better to run workshops using whiteboards or software tools?”  I’d argue that it’s not a question of one versus the other, they each have their strengths, the question should really be “when should I use a whiteboard and when should I rely on technology?”

              What is a workshop?

              A workshop is a very powerful collaboration and innovation tool. It normally involves a group of stakeholders with different areas of experience and expertise. It takes place in an open space where  the team have room to move around and interact. It is typically facilitated by someone that helps guide the team toward reaching a desired outcome.

              Workshops are used to understand problems, identify solutions and allow the key stakeholders to provide their input. The purpose of the whiteboard, or a software tool, is to help visualise the ideas under discussion and to explore them in more detail.

              So how do I know what to use?

              I’ve found that it depends on the stage the team is at in terms of their understanding of the issues. In the early stages of a project there’s a lot to figure out and everyone has a different point of view. This is the blank page phase where you have to get thoughts aligned. Using a whiteboard here is perfect. Thoughts are very unstructured and the freeform nature of a whiteboard allows the team to get all these thoughts visible. Once you have achieved this you will start to see relationships between the ideas and it’s this point where things start to become more concrete. (see Dan Roam’s Back of the Napkin for guidance on how to visualise ideas)

              This phase is where I would start to look at using a software tool. You’re starting to dig into the details, and the devil is often in the detail. At this stage the expertise of the participants really comes to the fore and conversations can be very quick and passionate. It’s important to keep these energy levels and concentration high to be most effective. The problem with manual driven workshops is that ideas come thick and fast, they get clarified and changed very quickly. It’s difficult to keep up with the flow and stopping and waiting for the facilitator to update a sticky note can sometimes be enough to distract the participants.

              By the same token the software tool itself needs to be visual and quick, this is not always the case. Whether wireframing, or producing flows, a quick and easy tool is required to get the best out of the workshop. And if you can get the content directly into the tool then there’s no need to follow up later putting the content into the tool based on some poor photo you took with your tablet.

              Having said all that, when I’m using a tool projected on to the wall I always have a whiteboard or flipchart available to capture additional ideas.

              The bottom line is that workshops are incredibly powerful ways to collaborate and engage with different stakeholders but it’s important to use the right tool at the right time so that you can get the most value from the experience. As a rule of thumb I’d start with the whiteboard in a very early stage, as soon as ideas start to firm up and the nature of the challenge is understood then it’s probably time to switch to a laptop and projector.

              Check out our free guide to process mapping

              We’ve designed Skore with this very much in mind. We’ve used many tools over the years, some are better than others in a live workshop environment, but they mostly rely on experienced users to get the most out of them. We wanted to create something that anyone could pickup and use to capture flows and user journeys with very little practice. 

              Skore versus MS Visio, Lucidchart and Gliffy

              For the purposes of this article we will consider Lucidchart, MS Visio and Gliffy to be general purpose diagramming tools. Given its ubiquity we will refer mainly to MS Visio for the examples.

              How is Skore different to Visio?

              This is the most common question we come across when introducing Skore to new audiences, especially analysts and consultant. We use Visio to create flowcharts and we create flowcharts in Skore so how are they really that different?

              It would be easy, but rather boring, to try and explain the difference feature by feature.

              Instead I would describe Skore as a strategic tool that helps organisations better understand themselves and therefore better able to improve and change. Whereas Visio is very much a tactical general purpose diagramming tool. I can design a business process flowchart in Visio, and I can design my new kitchen.

              Process – a strategic view

              For decades business leaders have considered their organisation’s processes as strategic assets. Processes flow through organisations, transforming inputs from suppliers into value for customers. They are the reason businesses function. And yet, after all this time, executives continue to struggle with problems of efficiency, standardisation, quality, risk and effectiveness.

              When taking a process view of an organisation it’s easy to see where the problems are. Bottlenecks and breakdowns happen most often where the process moves from one team to another, from one department from another, or from one person to another.

              Inefficiencies and errors thrive where different people deliver the same piece of work in different ways. Or design new work every time they do the same thing.

              As an organisational improvement tool process flowcharts are used to show us, and help us fix, these problems.

              So why do these problems keep coming back? Why do so many leaders still consider process and process efficiencies as a strategic priority? Why have we not solved this once and for all

              Process – a tactical view

              At a recent client the chief executive complained that he couldn’t understand why people still kept making the same mistakes despite his efforts to make the whole organisation more process focused. This reflects the fact that in most organisations ‘business’ processes are confused with flowcharts.

              Flowcharts are fantastic tools for visualising flows of activities or data. They say a picture paints a thousand words and a flowchart allows you to layout complex sequences of activities that may be sequential or parallel or both. Something a text document does very poorly.

              So can you draw a ‘business’ process using a flowchart? Absolutely, however it’s not so easy to create true business processes, at least not as easy as it is to draw any old boxes and lines. Something many people confuse with business processes.

              In practice flowcharts are created for many reasons, as very low level task instructions, decision trees, or for implementing specific parts of a system. When created in Visio they are flat 2 dimensional diagrams with the only guidelines and rules based on the experience of the user.

              Or they are created on whiteboards, they are large, complex and with varying levels of detail all displayed in one noodle soup of a flowchart.

              The problem with thinking of process as a strategic asset

              The problem is that processes exist at many levels of an organisation. There are the big strategic chunks of work that describe the core value chain. Or there are the management routines required to ensure work is optimised and continuously improved.

              There are the key activities that describe what the organisation, team or department needs to do. And there is the implementation level of work such as tasks or requirements for systems.

              These different levels of process are still often drawn in Visio but they require considerable expertise, skill and experience to create and manage them. In fact, in most cases, the same expertise is needed just to explain them and how they fit together.

              This expertise takes years to develop and individuals that fit this bill are rare and sought after. They are most likely to be interim roles or expensive consultants. Organisations bring them in for specific projects and programmes.

              This type of skill rarely gets embedded into an organisation and once the consultants leave their ability to update and maintain a true process view of the organisation goes with them. The organisation gradually reverts back to type.

              A further problem, and one that any good process consultant will be perfectly aware of, is that processes do no exist in isolation. A process doesn’t work without people to do it, nor does it work without the inputs and resources that are to be transformed. Again, without the systems, rules, machines and equipment that make it work, a process is nothing but an idea.

              To really understand an organisation’s strategic processes it is essential to have a good understanding of how all these interlocking pieces form the complete picture. Our experienced consultants have created a myriad of tools to assist them but it generally boils down to flowcharts and spreadsheets.

              Spreadsheet upon spreadsheet of data all related to specific parts of our process. Creating this monster requires a PhD in astrophysics and an army of analysts to create and keep in synch. No one understands how it hangs together expect the original artist that created it. And although they can answer any question using this resource, it appears as a clouded crystal ball to virtually everyone else

              How Skore solves this issue

              What we’ve just described is a status quo that has existed for many years. Visio, Lucidchart and similar tools have simply created an electronic version of brown paper and string, or it’s more modern equivalent, whiteboards and sticky notes.

              It doesn’t bring a fundamental change in thinking. It doesn’t address the issue of getting an organisation to recognise, articulate and love it’s processes in an ongoing and strategic fashion.

              Skore is different first in its approach and secondly how that is applied in the tool. Skore is designed to make it easy for more people in an organisation to learn how to capture and describe processes.

              And when I use the term ‘process’ I mean multi-level flowcharts that include all the other things an organisation needs to function. Not just the work activities, nor even the people, but all the systems and other information required.

              All this information is stored in a single model, not multiple flowcharts and multiple spreadsheets that need to be kept in synch manually, but a dynamic model that includes all the information linked together.

              This is also not some technical architectural tool. Skore follows some very simple rules that makes it very easy to understand and use. It’s not for everyone and while everyone can create boxes and lines in Visio, a significantly larger portion of your organisation will be able to develop good quality processes in Skore.

              A model in Skore can start at the top of the organisation showing our strategic buckets of work and, clicking a button, you can zoom into any level of detail you wish.

              It becomes a true strategic view of an organisation’s processes where the CEO is looking at the same model as everyone else.

              Get In Touch

              Process mapping versus documentation

              What is Process Mapping?

              Early on in my career as a consultant I remember explaining my new role to my Brother. “Process Mapping?” he replied, “I’ve had that done to me!”

              He worked in the finance industry and told me that someone in the compliance team had called him. “We’ll be mapping your processes over the next month.” He was told.

              “Six weeks later I received another call to tell me it had all been mapped!”

              While this is, perhaps, an extreme case it demonstrates the lack of engagement typically found in process mapping exercises. Why is this important?

              A lack of engagement is a symptom that demonstrates a lack on understanding as to what process mapping actually is. The term process mapping is often used to describe to act of documenting a process. However, here we argue that process documentation is only ONE of the outputs of a process mapping exercise. So what is Process Mapping?

              Documenting versus mapping

              I think of documenting a process as simply capturing what’s in front of you. You’re just documenting what you see. This is typically what happens when processes are captured through one-to-one interviews. The interviewee is explaining what they do and the analyst captures it. It’s one dimensional.

              Mapping a process is more like mapping the landscape. You can see what’s in front of you but you can’t see what’s behind that distant hill. You don’t know if there’s a village, or a lake behind it. Mapping requires you to take many different perspectives to build up a model that describes the landscape.

              In the same way process mapping is as much about documenting what isn’t obvious, or clear, to each person involved.

              It could be argued that running process interviews with different stakeholders will give these perspectives. The problem is that there is little opportunity to challenge different perspectives. It’s left to the analyst to interpret conflicting views without understanding why they happen.

              Process workshops

              It’s for this reason we recommend live process mapping workshop as the best way to map a process. Participants can describe how things work together. Differences can be discussed and the reasons for these differences ascertained.

              Differences in how work gets done typically develops organically and leads to duplication and loss of standardisation. Sometimes these differences are completely valid. It is very difficult for the analyst to identify which is which without the necessary debate generated in a workshop.

              Of course one or two workshops won’t completely map the process. An ongoing engagement with the team is required to ensure process maps are kept up to date and relevant.

              Keeping the process relevant

              A recent customer explained how they use process maps at their weekly team meetings. “We always open the process and have it displayed on the screen while we talk about the week ahead.” She explained. “We are in a heavily regulated industry and operate across more than 100 countries. We have to fit new regulations into our ways of working on a weekly basis.”

              “The process maps help us stick to a common language when we discuss the impact of each new regulation. It speeds up the implementation and reduces misunderstanding. It keeps us all on the same page during constant change.”

              Processes are rarely changed but the maps ensure the team focus on the relevant area and are aligned on what to do.

              Saving time

              A further advantage of the process workshop approach is the time it saves. While each person in the room still needs to be taken out of the business the analyst mapping the process only needs to be there once.

              When interviewing the analyst spends time with each participant individually. Then they must analyse the output of each interview and understand the differences, often getting agreement through additional meetings later.

              Using Skore app further speeds things up as, unlike using sticky notes and whiteboards, processes can be mapped directly into the tool and shared at the end of the workshop. Therefore there’s no need to spend time mapping the process into a tool afterwards.

              Process mapping is more than simply documenting a process in front of you. It’s about understanding the different perspectives that make up how that processes is run in a given organisation. It’s about understanding what isn’t obvious and why it happens. A good process map will be accepted by the roles it describes and will be used to continuously improve.

              Contact us to learn more about how Skore app accelerates and improves process mapping.

              Responsive Menu
              Add more content here...
              Responsive Menu
              Add more content here...
              Responsive Menu
              Add more content here...
              Responsive Menu
              Add more content here...
              Responsive Menu
              Add more content here...
              Responsive Menu
              Add more content here...
              Responsive Menu
              Add more content here...
              Responsive Menu
              Add more content here...
              Responsive Menu
              Add more content here...
              Responsive Menu
              Add more content here...
              Responsive Menu
              Add more content here...
              Responsive Menu
              Add more content here...
              Responsive Menu
              Add more content here...
              Responsive Menu
              Add more content here...
              Responsive Menu
              Add more content here...
              Responsive Menu
              Add more content here...
              Responsive Menu
              Add more content here...
              Responsive Menu
              Add more content here...
              Responsive Menu
              Add more content here...
              Responsive Menu
              Add more content here...
              Responsive Menu
              Add more content here...
              Responsive Menu
              Add more content here...
              Responsive Menu
              Add more content here...
              Responsive Menu
              Add more content here...
              Responsive Menu
              Add more content here...
              Responsive Menu
              Add more content here...
              Responsive Menu
              Add more content here...
              Responsive Menu
              Add more content here...
              Responsive Menu
              Add more content here...
              Responsive Menu
              Add more content here...
              Responsive Menu
              Add more content here...
              Responsive Menu
              Add more content here...
              Responsive Menu
              Add more content here...
              Responsive Menu
              Add more content here...
              Responsive Menu
              Add more content here...
              Responsive Menu
              Add more content here...
              Responsive Menu
              Add more content here...
              Responsive Menu
              Add more content here...
              Responsive Menu
              Add more content here...
              Responsive Menu
              Add more content here...
              Responsive Menu
              Add more content here...
              Responsive Menu
              Add more content here...
              Responsive Menu
              Add more content here...
              Responsive Menu
              Add more content here...
              Responsive Menu
              Add more content here...
              Responsive Menu
              Add more content here...
              Responsive Menu
              Add more content here...
              Responsive Menu
              Add more content here...
              Responsive Menu
              Add more content here...
              Responsive Menu
              Add more content here...
              Responsive Menu
              Add more content here...
              Responsive Menu
              Add more content here...
              Responsive Menu
              Add more content here...
              Responsive Menu
              Add more content here...
              Responsive Menu
              Add more content here...
              Responsive Menu
              Add more content here...
              Responsive Menu
              Add more content here...
              Responsive Menu
              Add more content here...
              Responsive Menu
              Add more content here...
              Responsive Menu
              Add more content here...
              Responsive Menu
              Add more content here...
              Responsive Menu
              Add more content here...
              Responsive Menu
              Add more content here...
              Responsive Menu
              Add more content here...
              Responsive Menu
              Add more content here...
              Responsive Menu
              Add more content here...
              Responsive Menu
              Add more content here...
              Responsive Menu
              Add more content here...
              Responsive Menu
              Add more content here...
              Responsive Menu
              Add more content here...
              Responsive Menu
              Add more content here...
              Responsive Menu
              Add more content here...
              Responsive Menu
              Add more content here...
              Responsive Menu
              Add more content here...
              Responsive Menu
              Add more content here...
              Responsive Menu
              Add more content here...
              Responsive Menu
              Add more content here...
              Responsive Menu
              Add more content here...
              Responsive Menu
              Add more content here...
              Responsive Menu
              Add more content here...
              Responsive Menu
              Add more content here...
              Responsive Menu
              Add more content here...
              Responsive Menu
              Add more content here...
              Responsive Menu
              Add more content here...
              Responsive Menu
              Add more content here...
              Responsive Menu
              Add more content here...
              Responsive Menu
              Add more content here...
              Responsive Menu
              Add more content here...
              Responsive Menu
              Add more content here...
              Responsive Menu
              Add more content here...
              Responsive Menu
              Add more content here...
              Responsive Menu
              Add more content here...
              Responsive Menu
              Add more content here...
              Responsive Menu
              Add more content here...
              Responsive Menu
              Add more content here...
              Responsive Menu
              Add more content here...
              Responsive Menu
              Add more content here...
              Responsive Menu
              Add more content here...
              Responsive Menu
              Add more content here...
              Responsive Menu
              Add more content here...
              Responsive Menu
              Add more content here...
              Responsive Menu
              Add more content here...
              Responsive Menu
              Add more content here...
              Responsive Menu
              Add more content here...
              Responsive Menu
              Add more content here...
              Responsive Menu
              Add more content here...
              Responsive Menu
              Add more content here...
              Responsive Menu
              Add more content here...
              Responsive Menu
              Add more content here...
              Responsive Menu
              Add more content here...
              Responsive Menu
              Add more content here...
              Responsive Menu
              Add more content here...
              Responsive Menu
              Add more content here...
              Responsive Menu
              Add more content here...
              Responsive Menu
              Add more content here...
              Responsive Menu
              Add more content here...
              Responsive Menu
              Add more content here...
              Responsive Menu
              Add more content here...
              Responsive Menu
              Add more content here...
              Responsive Menu
              Add more content here...
              Responsive Menu
              Add more content here...
              Responsive Menu
              Add more content here...
              Responsive Menu
              Add more content here...
              Responsive Menu
              Add more content here...
              Responsive Menu
              Add more content here...
              Responsive Menu
              Add more content here...
              Responsive Menu
              Add more content here...
              Responsive Menu
              Add more content here...
              Responsive Menu
              Add more content here...
              Responsive Menu
              Add more content here...
              Responsive Menu
              Add more content here...
              Responsive Menu
              Add more content here...
              Responsive Menu
              Add more content here...
              Responsive Menu
              Add more content here...
              Responsive Menu
              Add more content here...
              Responsive Menu
              Add more content here...
              Responsive Menu
              Add more content here...
              Responsive Menu
              Add more content here...
              Responsive Menu
              Add more content here...
              Responsive Menu
              Add more content here...
              Responsive Menu
              Add more content here...
              Responsive Menu
              Add more content here...
              Responsive Menu
              Add more content here...
              Responsive Menu
              Add more content here...
              Responsive Menu
              Add more content here...
              Responsive Menu
              Add more content here...
              Responsive Menu
              Add more content here...
              Responsive Menu
              Add more content here...
              Responsive Menu
              Add more content here...
              Responsive Menu
              Add more content here...
              Responsive Menu
              Add more content here...
              Responsive Menu
              Add more content here...
              Responsive Menu
              Add more content here...
              Responsive Menu
              Add more content here...
              Responsive Menu
              Add more content here...
              Responsive Menu
              Add more content here...
              Responsive Menu
              Add more content here...
              Responsive Menu
              Add more content here...
              Responsive Menu
              Add more content here...
              Responsive Menu
              Add more content here...
              Responsive Menu
              Add more content here...
              Responsive Menu
              Add more content here...
              Responsive Menu
              Add more content here...
              Responsive Menu
              Add more content here...
              Responsive Menu
              Add more content here...
              Responsive Menu
              Add more content here...
              Responsive Menu
              Add more content here...
              Responsive Menu
              Add more content here...
              Responsive Menu
              Add more content here...
              Responsive Menu
              Add more content here...
              Responsive Menu
              Add more content here...
              Responsive Menu
              Add more content here...
              Responsive Menu
              Add more content here...
              Responsive Menu
              Add more content here...
              Responsive Menu
              Add more content here...
              Responsive Menu
              Add more content here...
              Responsive Menu
              Add more content here...
              Responsive Menu
              Add more content here...
              Responsive Menu
              Add more content here...
              Responsive Menu
              Add more content here...
              Responsive Menu
              Add more content here...
              Responsive Menu
              Add more content here...
              Responsive Menu
              Add more content here...
              Responsive Menu
              Add more content here...
              Responsive Menu
              Add more content here...
              Responsive Menu
              Add more content here...
              Responsive Menu
              Add more content here...
              Responsive Menu
              Add more content here...
              Responsive Menu
              Add more content here...
              Responsive Menu
              Add more content here...
              Responsive Menu
              Add more content here...
              Responsive Menu
              Add more content here...
              Responsive Menu
              Add more content here...
              Responsive Menu
              Add more content here...
              Responsive Menu
              Add more content here...
              Responsive Menu
              Add more content here...
              Responsive Menu
              Add more content here...
              Responsive Menu
              Add more content here...
              Responsive Menu
              Add more content here...
              Responsive Menu
              Add more content here...
              Responsive Menu
              Add more content here...
              Responsive Menu
              Add more content here...
              Responsive Menu
              Add more content here...
              Responsive Menu
              Add more content here...
              Responsive Menu
              Add more content here...
              Responsive Menu
              Add more content here...
              Responsive Menu
              Add more content here...
              Responsive Menu
              Add more content here...
              Responsive Menu
              Add more content here...
              Responsive Menu
              Add more content here...
              Responsive Menu
              Add more content here...
              Responsive Menu
              Add more content here...
              Responsive Menu
              Add more content here...
              Responsive Menu
              Add more content here...
              Responsive Menu
              Add more content here...
              Responsive Menu
              Add more content here...
              Responsive Menu
              Add more content here...
              Responsive Menu
              Add more content here...
              Responsive Menu
              Add more content here...
              Responsive Menu
              Add more content here...
              Responsive Menu
              Add more content here...
              Responsive Menu
              Add more content here...
              Responsive Menu
              Add more content here...
              Responsive Menu
              Add more content here...
              Responsive Menu
              Add more content here...
              Responsive Menu
              Add more content here...
              Responsive Menu
              Add more content here...
              Responsive Menu
              Add more content here...
              Responsive Menu
              Add more content here...
              Responsive Menu
              Add more content here...
              Responsive Menu
              Add more content here...
              Responsive Menu
              Add more content here...
              Responsive Menu
              Add more content here...
              Responsive Menu
              Add more content here...
              Responsive Menu
              Add more content here...
              Responsive Menu
              Add more content here...
              Responsive Menu
              Add more content here...
              Responsive Menu
              Add more content here...
              Responsive Menu
              Add more content here...
              Responsive Menu
              Add more content here...
              Responsive Menu
              Add more content here...
              Responsive Menu
              Add more content here...
              Responsive Menu
              Add more content here...